


Now Reading: New Approach Targets RNA-Binding Protein to Treat Acute Myeloid Leukemia Models
-
01
New Approach Targets RNA-Binding Protein to Treat Acute Myeloid Leukemia Models
New Approach Targets RNA-Binding Protein to Treat Acute Myeloid Leukemia Models
Rapid Summary
- Recent advancements in targeting cell surface molecules have improved treatments for various cancers such as lymphoma, leukemia, and breast cancer using monoclonal antibodies and CAR T cells.
- AML remains challenging due to the overlap of key antigens on AML cells with healthy tissue, raising the risk of off-target toxicity.
- Novel strategies include identifying unique protein conformations and leveraging HLA-restricted peptides for specific cancer targeting.
- A breakthrough has been identifying tumor-selective cell surface expression of NPM1 (csNPM1), a protein previously linked to leukemia mutagenesis but not known to localize on cell surfaces until now.
- Experiments demonstrated csNPM1 clustering on surfaces of AML cells and other solid tumors like prostate cancer while sparing healthy tissues.
- Tested antibodies targeting csNPM1 enhanced survival rates in mouse models with no observed toxicity, showing anti-tumor efficacy across leukemia and solid cancers.
Indian Opinion Analysis
The revelation of NPM1 as a tumor-specific surface molecule represents a promising development for precision oncology. If scalable beyond murine models, these findings could lead to highly targeted therapies for acute myeloid leukemia (AML) or other malignancies while minimizing damage to healthy tissues-a major limitation in current treatments. For India’s healthcare landscape, integrating this innovation may be pivotal given its high burden of hematological disorders relative to resource limitations. Developing cost-effective production technologies could make advanced therapies attainable within public health systems. furthermore,collaborative R&D between academia and biotech firms could propel homegrown solutions aligned with emerging global trends.
Read MoreQuick Summary:
- A study examines the clustering and molecular characteristics of cell-surface NPM1 (csNPM1) in acute myeloid leukemia (AML) cells.
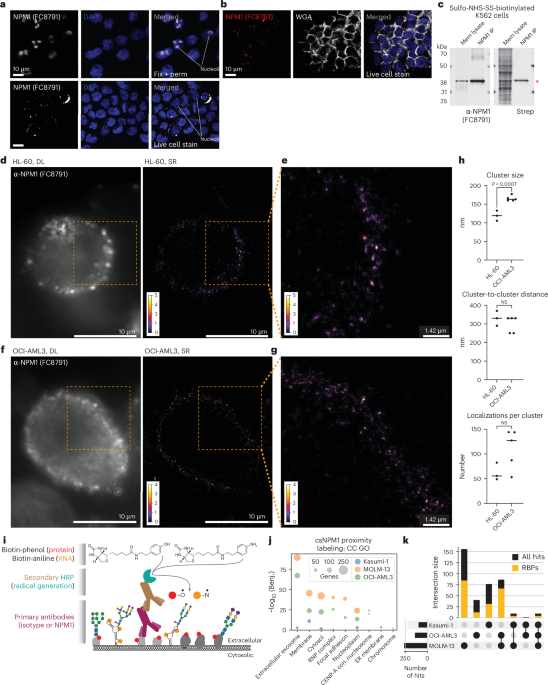
- Super-resolution microscopy shows csNPM1 forming uniform-sized clusters on the cell surface of HL-60 and OCI-AML3 cell lines, spaced approximately 300-330 nm apart.
- The research reveals two types of localization density in csNPM1 clusters, ranging from 50-80 to 120-140 localizations per cluster.
- Surface level analysis estimates ~1,000-24,000 antibody localizations per cell depending on the AML model used; findings were validated using flow cytometry methods.
- Molecular experiments identified strong enrichment for RNA-binding proteins (RBPs) proximal to csNPM1 across multiple AML models. RBPs comprised over 60% of proximity hits associated with csNPM1 clustering domains.
- Both wild-type and mutant forms of NPM1 can reach the cell surface across various human and murine AML models; mutation state influences overall expression levels but doesn’t entirely limit surface availability.
Indian Opinion Analysis:
The identification of nucleophosmin’s presence on leukemia cell surfaces shifts traditional understanding of intracellular RNA-binding proteins (RBPs).With high prevalence in both human and murine leukemia samples nonetheless of specific mutations, this discovery opens potential avenues for therapeutic targeting strategies focusing on naturally accessible protein markers like csNPM1.Such advancements could significantly impact research into biomarker-driven precision medicine approaches in hematological malignancies. India’s burgeoning biotechnology sector could explore monoclonal or bispecific antibodies for anti-NMP-targeted therapy via pathways such as ADCC or cytotoxic T-cell responses seen here. This development also emphasizes India’s role in translational cancer research that bridges molecular insights with drug development.
for further reading: LinkQuick Summary
- mAb2, an experimental monoclonal antibody, targets csNPM1 protein found on AML (Acute Myeloid Leukemia) cells.
- Flow cytometry analysis reveals strong staining of AML blasts and minimal binding on healthy hematopoietic stem and progenitor cells (HSPCs).
- In mouse models with high csNPM1 expression, mAb2 treatment significantly reduced leukemia markers such as spleen size and leukemic burden while improving hematopoietic recovery.
- Survival rates were prolonged in murine AML models treated with mAb2 compared to isotype controls in experiments reliant on immune mechanisms like ADCC or complement-mediated cytotoxicity.
- Human patient-derived xenograft (PDX) models also showed enhanced survival under mAb2 treatment,suggesting potential efficacy against human AML.
Read more: Nature Article
Indian Opinion Analysis
This study hints at promising advancements for cancer treatment through genotype-autonomous targeting mechanisms like the one demonstrated by mAb2 against Acute Myeloid Leukemia (AML). With minimal toxicity observed in healthy HSPCs in both human and murine samples, this approach mitigates concerns linked to off-target effects-critical for therapies that avoid impacting normal bone marrow function.For India’s healthcare sector, a development like mAb2 could contribute toward tackling difficult-to-treat cancers by enabling precision immunotherapy approaches without requiring extensive genetic profiling of patients beforehand.
Additionally, scalability considerations apply; if clinical trials confirm its applicability across varied mutations seen worldwide-including India’s diverse population-this method could democratize access to advanced oncology treatments. Further research adapting such breakthroughs to local contexts can help address affordability while ensuring medical equity across the country’s public health system.Quick Summary
- A novel antibody, mAb2, shows strong efficacy against leukemic cells in models of acute myeloid leukemia (AML), specifically targeting leukemic stem cell populations through surface binding to mutant NPM1 protein (csNPM1).
- mAb2 treatment demonstrated prolonged survival and reduced disease progression in mouse AML models, confirming its impact on leukemia-propagating compartments.
- Studies revealed stage-dependent and preferential binding of csNPM1 in malignant cells compared to healthy ones across multiple human patient samples.
- Beyond AML, mAb2 proved effective against solid tumors such as murine prostate carcinoma and colorectal cancer while showing no significant effect on melanoma models lacking csNPM1 expression.
- Further research indicated that csNPM1 may act as a marker for initiation and progression of malignancies due to glycosylation mechanisms facilitating surface localization.
Image from the article showing experimental data
Indian Opinion Analysis
The findings present a promising leap for cancer therapy targeting difficult-to-manage cancers like AML and specific solid tumors using innovative antibodies like mAb2. By specifically addressing leukemic stem cells and detecting pathogenic markers such as csNPM1 at various developmental stages, it tackles one of the core challenges in oncology research-how to effectively target recurring or treatment-resistant malignancy drivers while sparing normal tissues.
For India, where access to advanced treatments is frequently enough limited by cost or infrastructure gaps, therapies leveraging targeted antibodies could reduce long-term care costs associated with relapse-heavy cancers such as AML. The scalability potential for precision medicine tools also aligns well with efforts toward modernizing medical facilities under government health schemes.
Further local testing would be necessary considering demographic diversity among patients before adoption becomes feasible within healthcare systems at large scale across rural+urban divide Read more about study=
Related Posts
Stay Informed With the Latest & Most Important News
Previous Post
Next Post


Advertisement