Now Reading: Limitations of cell embedding metrics assessed using drifting islands
-
01
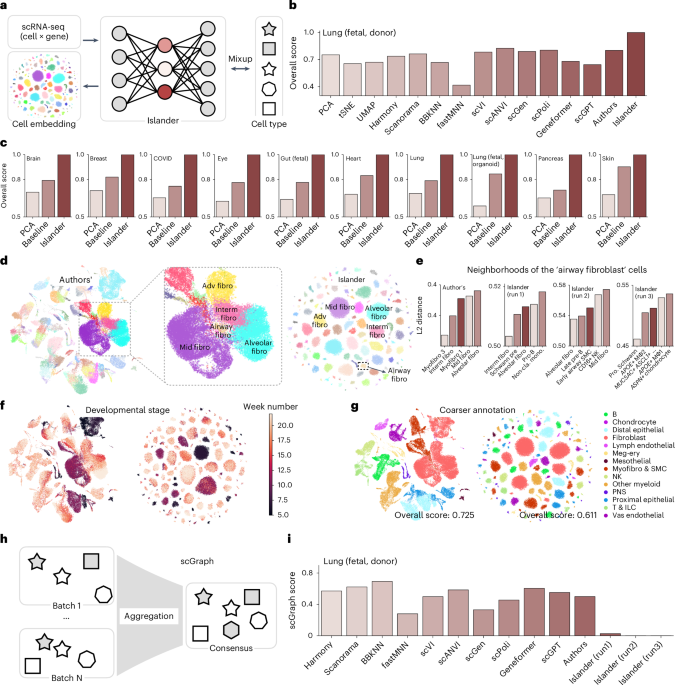
Limitations of cell embedding metrics assessed using drifting islands
Data availability
All data in this study are publicly available. Statistics, resources and corresponding studies are listed in Extended Data Table 1.
Code availability
The implementation code for Islander, as well as tutorial notebooks to reproduce the results in this paper, can be accessed from GitHub (https://github.com/Genentech/Islander). The standalone scgraph evaluation toolkit can be installed using pip (https://pypi.org/project/scgraph-eval/). For scIB evaluation pipelines, the implementations by Gayso et al. were obtained from GitHub (https://github.com/yoseflab/scib-metrics).
References
-
de Sande, B. V. et al. Applications of single-cell RNA sequencing in drug discovery and development. Nat. Rev. Drug Discov. 22, 496–520 (2023).
-
Zhang, M. J. et al. Polygenic enrichment distinguishes disease associations of individual cells in single-cell RNA-seq data. Nat. Genet. 54, 1572–1580 (2022).
-
Rood, J. E. et al. Impact of the Human Cell Atlas on medicine. Nat. Med. 28, 2486–2496 (2022).
-
Rood, J. E. et al. The Human Cell Atlas from a cell census to a unified foundation model. Nature 637, 1065–1071 (2025).
-
Hao, Y. et al. Integrated analysis of multimodal single-cell data. Cell 184, 3573–3587.e29 (2021).
-
Theodoris, C. V. et al. Transfer learning enables predictions in network biology. Nature 618, 616–624 (2023).
-
Heimberg, G. et al. A cell atlas foundation model for scalable search of similar human cells. Nature 638, 1085–1094 (2025).
-
Rosen, Y. et al. Universal cell embeddings: a foundation model for cell biology. Preprint at bioRxiv https://doi.org/10.1101/2023.11.28.568918 (2023).
-
Cui, H. et al. scGPT: toward building a foundation model for single-cell multi-omics using generative AI. Nat. Methods 21, 1470–1480 (2024).
-
Hao, M. et al. Large-scale foundation model on single-cell transcriptomics. Nat. Methods 21, 1481–1491 (2024).
-
Luecken, M. D. et al. Benchmarking atlas-level data integration in single-cell genomics. Nat. Methods 19, 41–50 (2022).
-
Tran, H. T. N. et al. A benchmark of batch-effect correction methods for single-cell RNA sequencing data. Genome Biol. 21, 12 (2020).
-
Wang, H. et al. Scientific discovery in the age of artificial intelligence. Nature 620, 47–60 (2023).
-
Liu, T., Li, K., Wang, Y., Li, H. & Zhao, H. Evaluating the utilities of foundation models in single-cell data analysis. Preprint at bioRxiv https://doi.org/10.1101/2023.09.08.555192 (2023).
-
Kedzierska, K. Z., Crawford, L., Amini, A. P. & Lu, A. X. Zero-shot evaluation reveals limitations of single-cell foundation models. Genome Biol. 26, 101 (2025).
-
Zhang, H., Cisse, M., Dauphin, Y. N. & Lopez-Paz, D. mixup: beyond empirical risk minimization. Preprint at https://arxiv.org/abs/1710.09412 (2018).
-
Siletti, K. et al. Transcriptomic diversity of cell types across the adult human brain. Science 382, eadd7046 (2023).
-
Kumar, T. et al. A spatially resolved single-cell genomic atlas of the adult human breast. Nature 620, 181–191 (2023).
-
Wang, S. K. et al. Single-cell multiome of the human retina and deep learning nominate causal variants in complex eye diseases. Cell Genom. 2, 100164 (2022).
-
Elmentaite, R. et al. Single-cell sequencing of developing human gut reveals transcriptional links to childhood Crohn’s disease. Dev. Cell 55, 771–783.e5 (2020).
-
Knight-Schrijver, V. R. et al. A single-cell comparison of adult and fetal human epicardium defines the age-associated changes in epicardial activity. Nat. Cardiovasc. Res. 1, 1215–1229 (2022).
-
He, P. et al. A human fetal lung cell atlas uncovers proximal–distal gradients of differentiation and key regulators of epithelial fates. Cell 185, 4841–4860.e25 (2022).
-
Solé-Boldo, L. et al. Single-cell transcriptomes of the human skin reveal age-related loss of fibroblast priming. Commun. Biol. 3, 188 (2020).
-
Heumos, L. et al. Best practices for single-cell analysis across modalities. Nat. Rev. Genet. 24, 550–572 (2023).
-
Korsunsky, I. et al. Fast, sensitive and accurate integration of single-cell data with harmony. Nat. Methods 16, 1289–1296 (2019).
-
Hie, B., Bryson, B. & Berger, B. Efficient integration of heterogeneous single-cell transcriptomes using scanorama. Nat. Biotechnol. 37, 685–691 (2019).
-
Polański, K. et al. BBKNN: fast batch alignment of single cell transcriptomes. Bioinformatics 36, 964–965 (2020).
-
Haghverdi, L. et al. Batch effects in single-cell rna-sequencing data are corrected by matching mutual nearest neighbors. Nat. Biotechnol. 36, 421–427 (2018).
-
Lopez, R. et al. Deep generative modeling for single-cell transcriptomics. Nat. Methods 15, 1053–1058 (2018).
-
Xu, C. et al. Probabilistic harmonization and annotation of single-cell transcriptomics data with deep generative models. Mol. Syst. Biol. 17, e9620 (2021).
-
Lotfollahi, M., Wolf, F. A. & Theis, F. J. scGen predicts single-cell perturbation responses. Nat. Methods 16, 715–721 (2019).
-
De Donno, C. et al. Population-level integration of single-cell datasets enables multi-scale analysis across samples. Nat. Methods 20, 1683–1692 (2023).
-
Khosla, P. et al. Supervised contrastive learning. In Advances in Neural Information Processing Systems 33 (eds Larochelle, H. et al.) 18661–18673 (NeurIPS, 2020).
-
Hoffer, E. & Ailon, N. Deep metric learning using triplet network. In Similarity-Based Pattern Recognition: SIMBAD 2015 (eds Feragen, A. et al.) 84–92 (Springer, 2015).
-
Sikkema, L. et al. An integrated cell atlas of the human lung in health and disease. Nat. Med. 29, 1563–1577 (2023).
-
Xu, C. et al. Automatic cell-type harmonization and integration across Human Cell Atlas datasets. Cell 186, 5876–5891.e20 (2023).
-
Wolf, F. A., Angerer, P. & Theis, F. J. SCANPY: large-scale single-cell gene expression data analysis. Genome Biol. 19, 15 (2018).
-
van der Maaten, L. & Hinton, G. Visualizing data using t-SNE. J. Mach. Learn. Res. 9, 2579–2605 (2008).
-
Becht, E. et al. Dimensionality reduction for visualizing single-cell data using UMAP. Nat. Biotechnol. 37, 38–44 (2019).
-
Gayoso, A. et al. A Python library for probabilistic analysis of single-cell omics data. Nat. Biotechnol. 40, 163–166 (2022).
-
Su, Y. et al. Multi-omics resolves a sharp disease-state shift between mild and moderate COVID-19. Cell 183, 1479–1495.e20 (2020).
-
Luecken, M. et al. Benchmarking atlas-level data integration in single-cell genomics—integration task datasets. figshare https://doi.org/10.6084/m9.figshare.12420968 (2022).
Acknowledgements
We thank R. Lopez, R. Sosic, P. He, M. Bereket, L. Dony, S.-J. Dunn, G. Eraslan, A. Gayoso, G. Heimberg, K. Huang, J. Marioni, D. Pe’er, L. Peng, Y. Roohani, Y. Rosen, A. Whitehead and J. Zhang for invaluable insights, along with all the members from the J.L. and A.R. labs and colleagues at the Human Cell Atlas, Chan Zuckerberg Initiative and Google DeepMind, for constructive and insightful discussions. J.L. was supported by the National Science Foundation through grants OAC-1835598 (CINES), CCF-1918940 (Expeditions) and DMS-2327709 (IHBEM), the Stanford Data Applications Initiative, the Wu Tsai Neurosciences Institute, the Stanford Institute for Human-Centered Artificial Intelligence, the Chan Zuckerberg Initiative, Amazon, Genentech, GSK, Hitachi, SAP and UCB.
Ethics declarations
Competing interests
H.W. and A.R. are employees of Genentech, a member of the Roche Group. A.R. has equity in Roche. A.R. is a cofounder and equity holder of Celsius Therapeutics and is an equity holder in Immunitas. Until 31 July 2020, A.R. was a scientific advisory board member of Thermo Fisher Scientific, Syros Pharmaceuticals, Neogene Therapeutics and Asimov. A.R. is a named inventor on multiple filed patents related to single-cell and spatial genomics, including for scRNA-seq, spatial transcriptomics, Perturb-Seq, compressed experiments and PerturbView.
Peer review
Peer review information
Nature Biotechnology thanks the anonymous reviewers for their contribution to the peer review of this work.
Additional information
Publisher’s note Springer Nature remains neutral with regard to jurisdictional claims in published maps and institutional affiliations.
Extended data
Extended Data Fig. 1
Drifting Cell Islands, different runs of Islander on fetal lung atlas (donor).
Extended Data Fig. 2 Design optimization for scGraph using human fetal lung atlas22.
a, b, Distribution of raw (a) and log1p-transformed (b) scRNA-seq counts. c, scGraph scores using log- 1p counts do not effectively flag distortions caused by drifting cell islands. scGraph scores (y axis) for embeddings generated with each method (x axis) using log-1p counts. d,e Effect of trim rate on PCA centroid locations and scGraph scores. d, Normalized mean square error between centroids (MSE, y-axis) at different trimming rates (x-axis), with centroids at 49% trimming as reference. e, Percentage difference (y-axis) between scGraph scores at various trimming rates (x-axis) compared to the score at 49% trimming. While small trim rates lead to larger changes in centroid coordinates, the corresponding changes in scGraph scores are relatively minor. Based on these observations, we selected a trim rate of 5% per side (10% total).
Extended Data Fig. 3 Scoring human fetal lung fibroblast22 embeddings by scIB and scGraph metrics.
a-c, Embeddings of 31,020 human fetal lung fibroblast profiles from 9 fibroblast subtypes across 29 batches, generated by the top scoring methods based on scIB (scANVI and Is- lander) or scGraph (Harmony and Authors’) and colored by developmental stage (a), cell types (b), or batch (c). Each method was trained on this subset and evaluated using both scIB and scGraph (Extended Data Table 5). d-e, Rankings of integration methods. scGraph (d, y axis) and scIB (e, y axis) scores for each of the 9 integration methods (x axis).
Supplementary information
Rights and permissions
Springer Nature or its licensor (e.g. a society or other partner) holds exclusive rights to this article under a publishing agreement with the author(s) or other rightsholder(s); author self-archiving of the accepted manuscript version of this article is solely governed by the terms of such publishing agreement and applicable law.
About this article

Cite this article
Wang, H., Leskovec, J. & Regev, A. Limitations of cell embedding metrics assessed using drifting islands.
Nat Biotechnol (2025). https://doi.org/10.1038/s41587-025-02702-z
-
Received:
-
Accepted:
-
Published:
-
DOI: https://doi.org/10.1038/s41587-025-02702-z


Related Posts


Stay Informed With the Latest & Most Important News
Previous Post
Next Post


Advertisement