Now Reading: Proteoform profiling of endogenous single cells from rat hippocampus at scale
-
01
Proteoform profiling of endogenous single cells from rat hippocampus at scale
Proteoform profiling of endogenous single cells from rat hippocampus at scale
Data availability
A list of 165 identified proteoforms, .RAW files and processed single-cell data are available on MassIVE repositories under accession codes MSV000096472 and MSV000092360. The biological pathway database for GSVA was retrieved from MSigDB of the Broad Institute (https://www.gsea-msigdb.org/gsea/msigdb). Source data are provided with this paper.
Code availability
Compiled scripts used to create and process I2MS files are available on GitHub (https://github.com/NRTDP/scPiMS). Additional software and data that support and corroborate the findings of this study are available on GitHub (https://github.com/NRTDP/scPiMS).
References
-
Kelly, R. T. Single-cell proteomics: progress and prospects. Mol. Cell. Proteomics 19, 1739–1748 (2020).
-
Schoof, E. M. et al. Quantitative single-cell proteomics as a tool to characterize cellular hierarchies. Nat. Commun. 12, 3341 (2021).
-
Vistain, L. F. & Tay, S. Single-cell proteomics. Trends Biochem. Sci. 46, 661–672 (2021).
-
Goltsev, Y. et al. Deep profiling of mouse splenic architecture with CODEX multiplexed imaging. Cell 174, 968–981 (2018).
-
Slavov, N. Driving single cell proteomics forward with innovation. J. Proteome Res. 20, 4915–4918 (2021).
-
Ctortecka, C. & Mechtler, K. The rise of single-cell proteomics. Anal. Sci. Adv. 2, 84–94 (2021).
-
MacCoss, M. J. et al. Sampling the proteome by emerging single-molecule and mass spectrometry methods. Nat. Methods 20, 339–346 (2023).
-
Matzinger, M., Mayer, R. L. & Mechtler, K. Label-free single cell proteomics utilizing ultrafast LC and MS instrumentation: a valuable complementary technique to multiplexing. Proteomics 23, e2200162 (2023).
-
Ctortecka, C. et al. An automated nanowell-array workflow for quantitative multiplexed single-cell proteomics sample preparation at high sensitivity. Mol. Cell. Proteomics 22, 100665 (2023).
-
Budnik, B., Levy, E., Harmange, G. & Slavov, N. SCoPE-MS: mass spectrometry of single mammalian cells quantifies proteome heterogeneity during cell differentiation. Genome Biol. 19, 161 (2018).
-
Mund, A. et al. Deep visual proteomics defines single-cell identity and heterogeneity. Nat. Biotechnol. 40, 1231–1240 (2022).
-
Dou, M. et al. High-throughput single cell proteomics enabled by multiplex isobaric labeling in a nanodroplet sample preparation platform. Anal. Chem. 91, 13119–13127 (2019).
-
Shalek, A. K. et al. Single-cell transcriptomics reveals bimodality in expression and splicing in immune cells. Nature 498, 236–240 (2013).
-
Su, P. et al. Highly multiplexed, label-free proteoform imaging of tissues by individual ion mass spectrometry. Sci. Adv. 8, eabp9929 (2022).
-
McGee, J. P. et al. Automated imaging and identification of proteoforms directly from ovarian cancer tissue. Nat. Commun. 14, 6478 (2023).
-
Su, P. et al. Single cell analysis of proteoforms. J. Proteome Res. 23, 1883–1893 (2024).
-
Kafader, J. O. et al. Multiplexed mass spectrometry of individual ions improves measurement of proteoforms and their complexes. Nat. Methods 17, 391–394 (2020).
-
Wörner, T. P. et al. Resolving heterogeneous macromolecular assemblies by Orbitrap-based single-particle charge detection mass spectrometry. Nat. Methods 17, 395–398 (2020).
-
Su, P. et al. Standardized workflow for multiplexed charge detection mass spectrometry on Orbitrap analyzers. Nat. Protoc. https://doi.org/10.1038/s41596-024-01091-y (2025).
-
Bennett, H. M., Stephenson, W., Rose, C. M. & Darmanis, S. Single-cell proteomics enabled by next-generation sequencing or mass spectrometry. Nat. Methods 20, 363–374 (2023).
-
Smith, L. M. & Kelleher, N. L. Proteoforms as the next proteomics currency. Science 359, 1106–1107 (2018).
-
Melby, J. A. et al. High sensitivity top-down proteomics captures single muscle cell heterogeneity in large proteoforms. Proc. Natl Acad. Sci. USA 120, e2222081120 (2023).
-
Johnson, K. R., Gao, Y., Greguš, M. & Ivanov, A. R. On-capillary cell lysis enables top-down proteomic analysis of single mammalian cells by CE–MS/MS. Anal. Chem. 94, 14358–14367 (2022).
-
Neumann, E. K., Comi, T. J., Rubakhin, S. S. & Sweedler, J. V. Lipid heterogeneity between astrocytes and neurons revealed by single-cell MALDI-MS combined with immunocytochemical classification. Angew. Chem. Int. Ed. 58, 5910–5914 (2019).
-
Castro, D. C., Xie, Y. R., Rubakhin, S. S., Romanova, E. V. & Sweedler, J. V. Image-guided MALDI mass spectrometry for high-throughput single-organelle characterization. Nat. Methods 18, 1233–1238 (2021).
-
Rubakhin, S. S. & Sweedler, J. V. Characterizing peptides in individual mammalian cells using mass spectrometry. Nat. Protoc. 2, 1987–1997 (2007).
-
Delcourt, V. et al. Spatially-resolved top-down proteomics bridged to MALDI MS imaging reveals the molecular physiome of brain regions. Mol. Cell. Proteomics 17, 357–372 (2018).
-
Hanrieder, J., Wicher, G., Bergquist, J., Andersson, M. & Fex-Svenningsen, Å. MALDI mass spectrometry based molecular phenotyping of CNS glial cells for prediction in mammalian brain tissue. Anal. Bioanal. Chem. 401, 135–147 (2011).
-
Sharma, K. et al. Cell type- and brain region-resolved mouse brain proteome. Nat. Neurosci. 18, 1819–1831 (2015).
-
Hänzelmann, S., Castelo, R. & Guinney, J. GSVA: gene set variation analysis for microarray and RNA-seq data. BMC Bioinform. 14, 7 (2013).
-
Zeisel, A. et al. Cell types in the mouse cortex and hippocampus revealed by single-cell RNA-seq. Science 347, 1138–1142 (2015).
-
Kempermann, G., Jessberger, S., Steiner, B. & Kronenberg, G. Milestones of neuronal development in the adult hippocampus. Trends Neurosci. 27, 447–452 (2004).
-
Wang, P.-S. et al. Crucial roles of the ARP2/3 complex during mammalian corticogenesis. Development 143, 2741–2752 (2016).
-
Stürner, T. et al. Transient localization of the ARP2/3 complex initiates neuronal dendrite branching in vivo. Development 146, dev171397 (2019).
-
Rossi, D. J., Brady, J. D. & Mohr, C. Astrocyte metabolism and signaling during brain ischemia. Nat. Neurosci. 10, 1377–1386 (2007).
-
Almeida, A., Almeida, J., Bolaños, J. P. & Moncada, S. Different responses of astrocytes and neurons to nitric oxide: the role of glycolytically generated ATP in astrocyte protection. Proc. Natl Acad. Sci. USA 98, 15294–15299 (2001).
-
Lan, Y., Zou, Z. & Yang, Z. Single cell mass spectrometry: towards quantification of small molecules in individual cells. Trends Anal. Chem. 174, 117657 (2024).
-
Hollas, M. A. R. et al. The Human Proteoform Atlas: a FAIR community resource for experimentally derived proteoforms. Nucleic Acids Res. 50, D526–D533 (2022).
-
Neumann, E. K. et al. Protocol for multimodal analysis of human kidney tissue by imaging mass spectrometry and CODEX multiplexed immunofluorescence. STAR Protoc. 2, 100747 (2021).
-
Neumann, E. K., Ellis, J. F., Triplett, A. E., Rubakhin, S. S. & Sweedler, J. V. Lipid analysis of 30,000 individual rodent cerebellar cells using high-resolution mass spectrometry. Anal. Chem. 91, 7871–7878 (2019).
-
Bankhead, P. et al. QuPath: open source software for digital pathology image analysis. Sci. Rep. 7, 16878 (2017).
-
Schneider, C. A., Rasband, W. S. & Eliceiri, K. W. NIH Image to ImageJ: 25 years of image analysis. Nat. Methods 9, 671–675 (2012).
-
Yin, R., Burnum-Johnson, K. E., Sun, X., Dey, S. K. & Laskin, J. High spatial resolution imaging of biological tissues using nanospray desorption electrospray ionization mass spectrometry. Nat. Protoc. 14, 3445–3470 (2019).
-
Laskin, J., Heath, B. S., Roach, P. J., Cazares, L. & Semmes, O. J. Tissue imaging using nanospray desorption electrospray ionization mass spectrometry. Anal. Chem. 84, 141–148 (2012).
-
Kafader, J. O. et al. STORI plots enable accurate tracking of individual ion signals. J. Am. Soc. Mass. Spectrom. 30, 2200–2203 (2019).
-
Hollas, M. A. R., Fellers, R. T., Su, P., Pla, I. & Kelleher, N. L. Single-cell application. Zenodo https://doi.org/10.5281/zenodo.14611173 (2025).
-
Horn, D. M., Zubarev, R. A. & McLafferty, F. W. Automated reduction and interpretation of high resolution electrospray mass spectra of large molecules. J. Am. Soc. Mass. Spectrom. 11, 320–332 (2000).
-
Kaufman, L. & Rousseeuw, P. J. in Finding Groups in Data: An Introduction to Cluster Analysis (eds Kaufman, L. & Rousseeuw, P. J.) Ch. 2 (Wiley, 1990).
-
Kafader, J. O. et al. Individual ion mass spectrometry enhances the sensitivity and sequence coverage of top-down mass spectrometry. J. Proteome Res. 19, 1346–1350 (2020).
Acknowledgements
This study was funded by the National Institutes of Health (P41 GM108569 and UH3 CA246635, to N.L.K.; P30 DA018310, to N.L.K. and J.V.S.; K99 AI183290, to P.S.; P30 CA060553, to the Robert H. Lurie Comprehensive Cancer Center), The Investigator Program at the Chan Zuckerberg Biohub Chicago (to N.L.K. and J.V.S.) and Northwestern University.
Ethics declarations
Competing interests
J.O.K. and N.L.K. report a conflict of interest with I2MS technology, being commercialized by Thermo Fisher Scientific. R.T.F., J.B.G. and N.L.K. are involved in commercialization of software. N.L.K. is a paid consultant for Thermo Fisher Scientific. The other authors declare no competing interests.
Peer review
Peer review information
Nature Biotechnology thanks Nikolai Slavov and the other, anonymous, reviewer(s) for their contribution to the peer review of this work.
Additional information
Publisher’s note Springer Nature remains neutral with regard to jurisdictional claims in published maps and institutional affiliations.
Teaser
Intact protein sampling based on individual ion mass spectrometry enables a scalable approach to single-cell proteomics.
Extended data
Extended Data Fig. 1 Single cell feature selection demonstrated using the data shown in Fig. 1b-d.
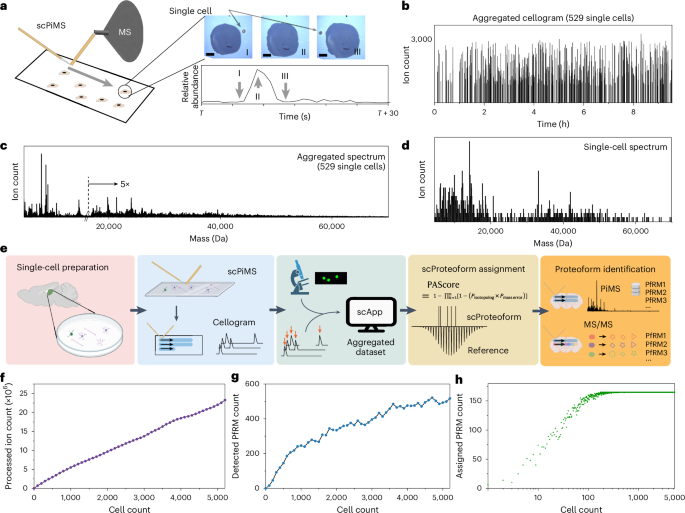
From 752 optically-registered cells, 529 single cells were detected based on filtering of distance and scPiMS sampling conditions (annotated in panel (a)). Location of the 529 single cells are registered in the pixel-based graph in panel (a). (b) Cellogram single cell feature selection purely based on peak features (more in Methods). Using a peak threshold of 750 ions and a spacing of 7 scans, 529 single cell-like peak profiles were registered, which was well correlated with the optical registration and statistical modeling.
Extended Data Fig. 2 Mass spectrum of (a) the proteoform library obtained from hippocampal-specific PiMS experiment and (b) aggregated 5272-cell dataset I with proteoform annotations.
Mass spectrum of (a) the proteoform library obtained from hippocampal-specific PiMS experiment (a 2.5 mm by 2.5 mm hippocampal region of a 10-micron thin brain section with a total of 38 million ions and 15930 MS scans) and (b) aggregated 5272-cell dataset I with annotations of the 165 identified proteoforms in Supplementary Data 5.5 and the 23 MS/MS-identified proteoforms in Supplementary Data 4. The inset in (a) shows the detailed annotation of MBP (P02688-4) proteoforms at ~14.1 kDa. The proteoforms labeled in gray are abundant proteins found in hippocampal tissues but not part of the hippocampal-enriched biological pathways, therefore they were not included in the IMT database and not used for subsequent cell typing effort. However, these proteoforms were identified using our MS/MS approach and were confirmed to be ubiquitously-expressed brain proteins (for example, ubiquitin, ATP synthase subunits-ATP5E, myelin basic proteins-MBPs, brain acid soluble protein-BASP1) that only have a minor contribution to cell type classification of neurons and glial cells.
Extended Data Fig. 3 PAScore summary of the 5272-cell dataset I with 10% FDR and 10 decoy sequences for each proteoform matching event.
(a) pie chart of a total of 869,880 candidate matching events with 45.5% missing values, 49.5% FDR-filtered PAScores, and 5% non-zero PAScores assigned to 165 proteoforms identified from the rat hippocampus. (b) PAScore distribution of FDR-filtered matching events with an average of 1.86 ions matched to a proteoform (blue portion in the pie chart in panel a). (c) Non-zero PAScores assigned to the 165 identified proteoforms plotted according to number of ions (2-8) matched to the proteoforms (red portion comprising 5% in the pie chart in panel a). (d) Distribution of PAScores for the 5% of proteoforms assigned in single cells to one of the 165 identified proteoforms (that is, a total of 43.5k scProteoforms).
Extended Data Fig. 4 Principal component analysis of 4927 cells colored according to the cell type assigned.
The pink arrows are the ‘biplot’ vectors representing the coefficients of the biological pathway variables on the principal components shown in Fig. 2b. The Neu, Ast and Mgl labels show the locations of the single cells with optical images in Fig. 2b.
Extended Data Fig. 5 Total and proteoform-assigned ion count per cell distribution across cell types in the 5272-cell dataset I.
Total (a) and proteoform-assigned (b) ion count per cell distribution across cell types in the 5272-cell dataset I. Ast, astrocytes; Mgl, microglia; Neu, neurons.
Extended Data Fig. 7 Mass spectra of the monoacetylated ARP5L proteoform constructed from 50, 100, 200, and 300 single neurons and individual ion mass spectra from three single neurons showing assignment of the monoacetylated ARP5L proteoform.
(a) Mass spectra of the monoacetylated ARP5L proteoform constructed from 50, 100, 200, and 300 single neurons. The theoretical isotopic distribution is shown in the mirrored panel. (b) Individual ion mass spectra from three single neurons showing assignment of the monoacetylated ARP5L proteoform in its mass range with the PAScores in cells numbered #784, #1247 and #605.
Extended Data Fig. 8 Different representation of the mass spectrum of cell #179 shown in Fig. 2d.
Different representation of the mass spectrum of cell #179 shown in Fig. 2d (middle and bottom). The top panel shows a single-ion representation that shows the breakdown of the four-ion composite peak, of which two ions were matched to an ALDOA proteoform and two were not.
Extended Data Fig. 9 Bar and scatter plots of detected proteoforms involved in glucose metabolism (REACTOME Stable Identifier: R-HSA-70326) and glial fibril acidic protein (GFAP, a classical immunofluorescent astrocytic marker) across cell types.
Bar and scatter plots of detected proteoforms involved in glucose metabolism (REACTOME Stable Identifier: R-HSA-70326) and glial fibril acidic protein (GFAP, a classical immunofluorescent astrocytic marker) across cell types that showed consistent elevated PAScores in the astrocytic population. Each panel is labeled with the proteoform name and UniProt accession together with a proteoform descriptor. The average unadjusted PAScores are labeled using solid diamond symbols. The upper side of the whiskers indicate PAScore at 99% percentile.
Extended Data Fig. 10 Bar and scatter plots of detected proteoforms involved in HIV Infection (REACTOME Stable Identifier: R-HSA-162906) and Host Interactions of HIV Factors (REACTOME Stable Identifier: R-HSA-162909) across cell types.
Bar and scatter plots of detected proteoforms involved in HIV Infection (REACTOME Stable Identifier: R-HSA-162906) and Host Interactions of HIV Factors (REACTOME Stable Identifier: R-HSA-162909) across cell types that showed consistent elevated PAScores in the microglia population. Each panel is labeled with the proteoform name and UniProt accession together with a proteoform descriptor. The average unadjusted PAScores are labeled using solid diamond symbols. The upper side of the whiskers indicate PAScore at 99% percentile.
Supplementary Information
Source data
Rights and permissions
Springer Nature or its licensor (e.g. a society or other partner) holds exclusive rights to this article under a publishing agreement with the author(s) or other rightsholder(s); author self-archiving of the accepted manuscript version of this article is solely governed by the terms of such publishing agreement and applicable law.
About this article

Cite this article
Su, P., Hollas, M.A.R., Pla, I. et al. Proteoform profiling of endogenous single cells from rat hippocampus at scale.
Nat Biotechnol (2025). https://doi.org/10.1038/s41587-025-02669-x
-
Received:
-
Accepted:
-
Published:
-
DOI: https://doi.org/10.1038/s41587-025-02669-x


Related Posts


Stay Informed With the Latest & Most Important News
Previous Post
Next Post


Advertisement