


















Now Reading: Google Maps now shows air quality in Delhi-NCR and across India
-
01
Google Maps now shows air quality in Delhi-NCR and across India


The Story in Brief
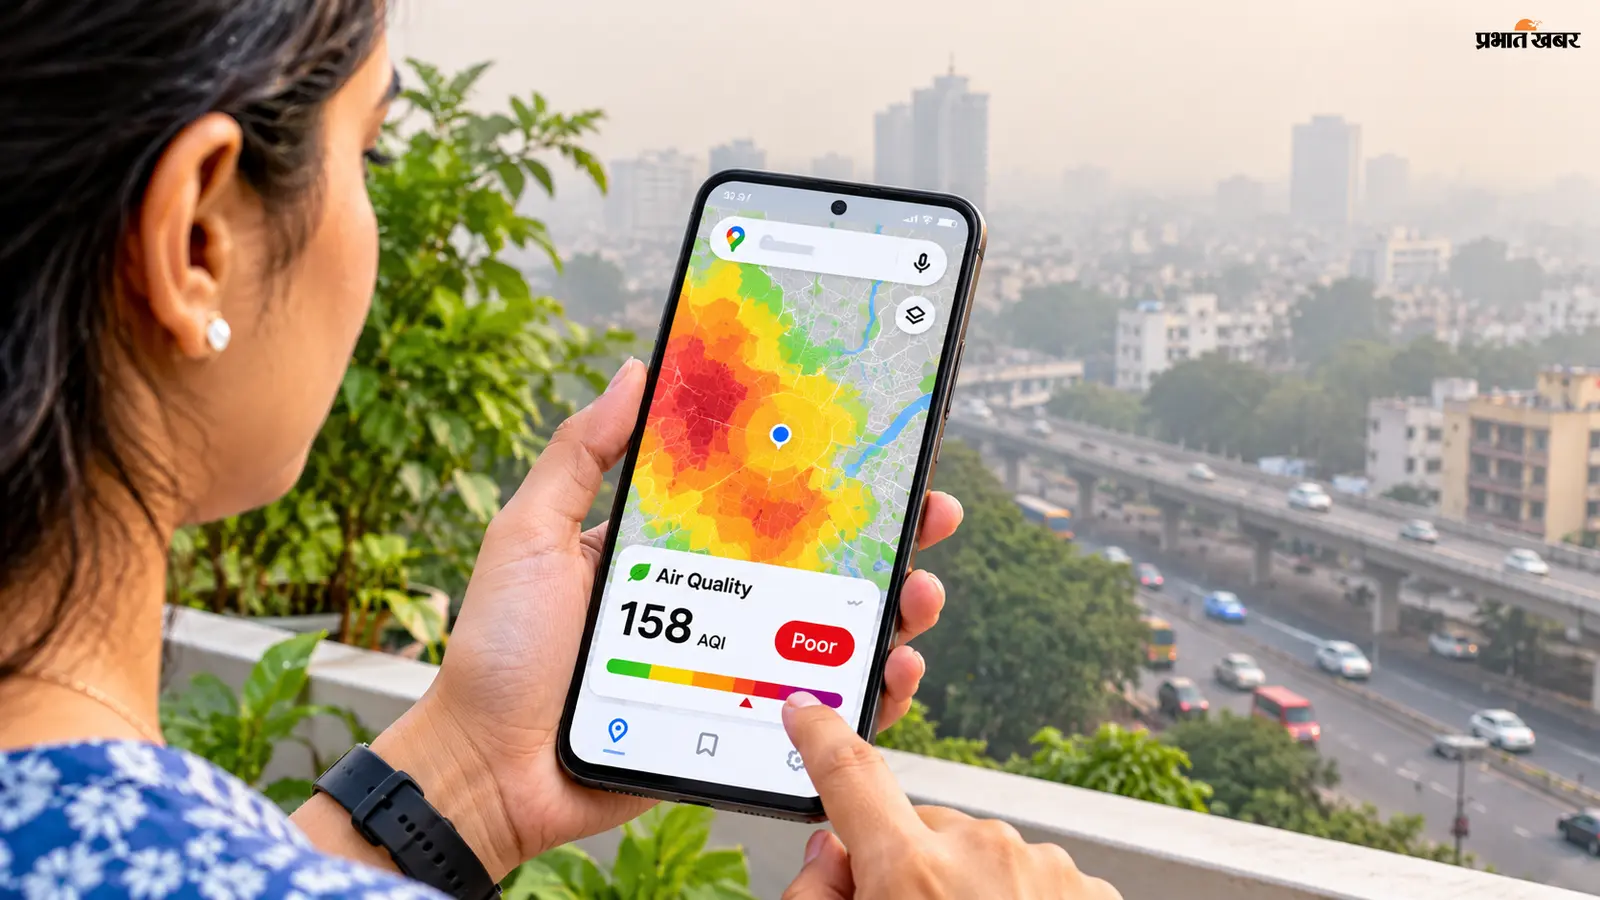
Google Maps has introduced an Air Quality feature that lets users check the AQI (Air Quality Index) of their area directly on the map, without downloading a separate app. The tool uses colour coding: green for good, yellow for moderate, orange for unhealthy for sensitive groups, red for poor, purple for very poor, and maroon for hazardous.
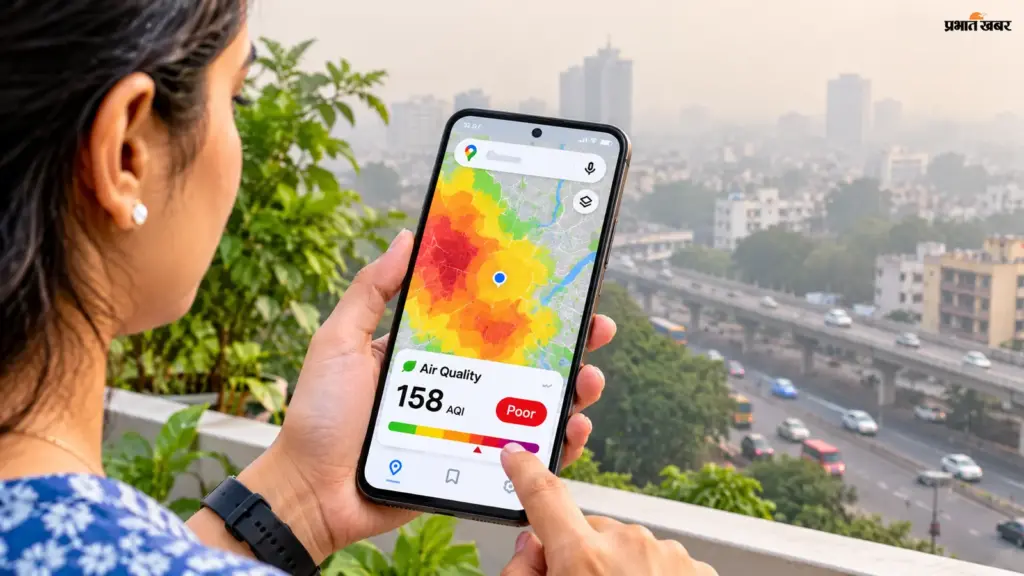
Users can enable the layer by tapping the Layers icon in the mobile app or clicking the Layers button on the desktop site, then selecting Air Quality. Tapping a location or monitoring station icon shows the AQI number and more details. Some users may also see AQI in the Weather widget under the Explore tab. Google cautions that readings are not a precise measure of the air immediately outside a user’s home, as pollution levels can vary between monitoring stations and data may be delayed. The colour scales and measurement methods differ by country.
Indian Opinion Analysis
Millions in Delhi-NCR and northern India now have a ready visual check on air quality before stepping out. Google Maps’ Air Quality layer, colour-coded from green to maroon, puts Environmental Protection Agency-style indices directly into daily navigation. The tool resolves one problem for users, knowing local conditions without a separate app, but leaves another open: Google warns that readings are not street-level exact and may be delayed. Users bear the responsibility to interpret the colour scale, which can differ by country. For those who do look, the next step is to match the AQI number against their own plans for the day.
Source: prabhatkhabar.com
This brief was synthesised by AI from the source linked above. Methodology and corrections.