






















Now Reading: Mid-cap fund benchmark overlap ranges from 11.6% to 51.9%
-
01
Mid-cap fund benchmark overlap ranges from 11.6% to 51.9%


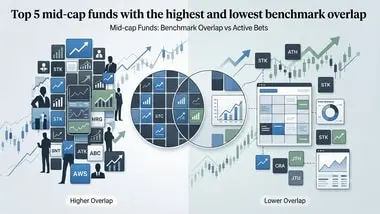
A Value Research analysis of 34 mid-cap mutual funds shows portfolio overlap with the Nifty Midcap 150 TRI ranging from 11.6% to 51.9%, based on August 2026 portfolio disclosures. Edelweiss Mid Cap…
A Value Research analysis of 34 mid-cap mutual funds shows portfolio overlap with the Nifty Midcap 150 TRI ranging from 11.6% to 51.9%, based on August 2026 portfolio disclosures. Edelweiss Mid Cap Fund had the highest overlap at 51.9%, while Quant Mid Cap Fund had the lowest at 11.6%.
Higher overlap did not guarantee lower returns. ITI Mid Cap Fund, with 45.9% overlap, delivered a 10.35% one-year return, the highest among the top five high-overlap funds. HSBC Midcap Fund, with 26.5% overlap, posted the highest one-year return across all funds at 18.65%. Quant Mid Cap Fund, despite the lowest overlap, returned only 3.56%.
Benchmark overlap indicates how differently a fund is positioned from its index, not a predictor of outperformance. Investors should view it as a measure of active positioning that can lead to divergence on both upside and downside.
Indian Opinion Analysis
The wide dispersion in mid-cap fund overlap, nearly five-fold, reflects the freedom fund managers have under SEBI's 65% mid-cap investment mandate. A low overlap does not guarantee alpha, the Quant Mid Cap Fund's 3.56% return shows that active bets can underperform when sector calls go wrong. The real test is a manager's ability to pick stocks outside the index, not just the number of deviations. Investors should compare overlap alongside rolling returns and expense ratios over a full market cycle. The next data point to watch is the October 2026 portfolio disclosures, which will show whether the gap between high- and low-overlap funds is widening or narrowing.
Source: livemint.com
This brief was synthesised by AI from the source linked above.